
Intranet application live LAN
Application offers graphics view of quality of LAN connectivity to the Internet, helps to scan network devices in LAN and gives possibility of their test. Devices data are stored in database and it is possible to quickly start graphic ping on any device, or link to web page of printers or switches without searching and copying of IP address.
Internet connectivity monitoring
Part of application is script running every minute. Script pings three different servers and response time is stored into database for one day period. Failed ping is in addition stored into long-term table. Values from database are then used for following graphs.
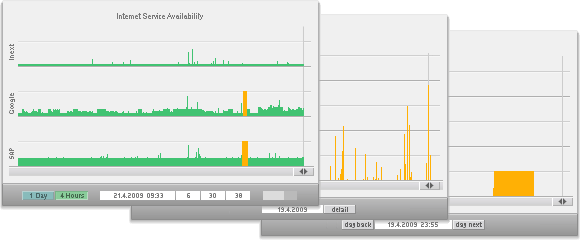
The graph in the left traces actual values of response time for three tested servers. DNS server of provider shows ability to communicate on the last mile. In the middle is Google server and below is remote SAP server, which communicates over VPN. Drop-out of connection in way from provider farther to the Internet is visible in screenshot.
Graph operates in two modes, one minute records, where every ping is represented by one bar and spans slightly more than four hours. 5-minute mode spans last 24 hours and each bar is average value of pings. By the help of Ajax is graph updated by actual values every minute, so it is "live" graph. Small indicator on the right, counts down time when new data will be delivered.
Connection history displays counts of drop-outs per day (range perhaps last 3/4 of the year). Such graph is seen in the middle part of screenshot. Single days can be unrolled to show detail situation for given day. It is seen on the right, where planned maitenace of SAP server for few hours is displayed. Ping response time is not displayed here, only failed pings are visible.
LAN schema and equipment status
Computer net diagram is graphic, simplified display of network. When test is started every icon (device) is tested by the help of Ajax and result is expressed by color of icon. In this regards diagram is "live". After clicks on device icon, message in left part of page displays description, function and place of given device.
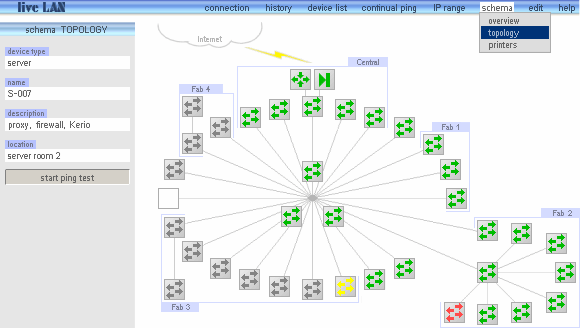
In screenshot is chart with accent on LAN topology. You can see switches, VPN router and firewall. Green icons represent network elements which are in operation, yellow icon is just tested device and red icon is device which does not reply to ping. Test proceeds icon by icon and grey elements were not yet tested.
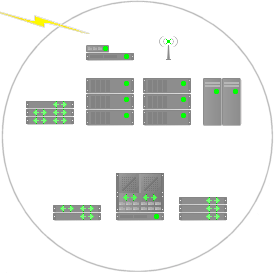
Another chart view of LAN displays network divided according to production unit. In the left is screenshot of one unit. Other units (circuits) distinguishes by numbers and type of network elements. At first sight is clear which production unit has trouble. Icons of network devices are only simplified outline, silhouette and wiring is quite omitted.
Basic outline of schema is painted in graphic editor as a regular bitmap picture. Over this shape device icons are put down. Selection of icons from library and dragging them into correct position is implemented by edit part of this application.
Every icon consists from four parts with diverse color indicator for different state of device. Principle of icon color change is much like sprite swapping. Because of background print difficulties, icons are displayed as foreground <img> instead of <div> background.
IP address of VLAN utilization
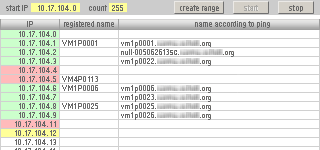
LAN is usually divided into address zones, or sometimes even into VLANs. From table of address allocation sections are links to page for section scanning. Beside is screenshot of small part of print section scanning page, real situation from time when LAN was migrated to new address space.
You can see all address of selected section, names registered in database and actual device names found by the help of ping. Green address are responding to ping, red address do not respond, yellow address is just tested and white background means address not tested yet. You can see that only a few printers are well migrated and have corresponding name. Besides this application originates as helping tool for LAN migration.
Similar tables are for device type lists (servers, switches, printers and other devices). From that tables are links to web pages of printers and switches for basic diagnostics, status or setting of that device. Another references are to page with continual, graphic ping. This part of application you can try out here.
Application notes
Advantage of this intranet application is that it is possible to run that on any computer in company, there is no need of any installation on the client side. Network administrator finds out required data any time and wherever in the field. This application was designed as network documentation tool, not as sophisticated tool for network diagnostics.
Ping is quick method, or test, which finds out, if device is able to communicate over network. It means that device is connected to net and power is on. It is impossible to determine whether all required services are running on that device. When printing spooler is blocked, both server and printer respond positive to ping, but printing is not possible anyway.
For PCs and stations which have allocated IP address over DHCP, there is small point to set them into database. Partly because their address is not fixed and above all, most of PC with Windows system have blocked ping because of so called safety. At ping test are such devices invisible.
updated 28.06.2008