
Intranet application Glass Melting
Glass melting is executed in glass tank. To keep very high quality of glass with minimum defects, to meet chemical and physical parameters of glass, it is useful to have control system for glass tank.
Control system with the help of PLCs makes data collection from several hundred sensors, control loops calculate output values and adjust e.g. valves. Measured data are stored in SQL server for analyses and trends. Process visualization is done by special software on standard PCs.
Process data are visible only on stations, where program for process visualisation is installed. These are PCs: melting chief, operators and technologist. Visualisation software offers perfect possibilities for data presentation, but certain level of knowledge how to handle that program is required, and price of program is not from cheapest ones.
Application described here was created with the goal to make visible data from melting control system to the other users, simplify data access and save some cost on client licences.
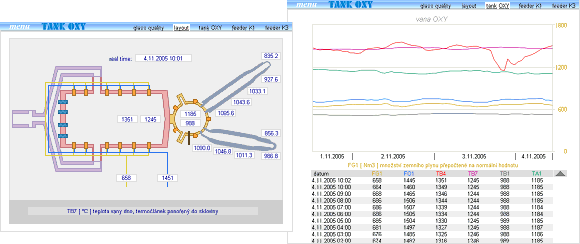
In the left part of screenshot you can see schematic diagram of glass tank, where main measuring points are mapped into small white boxes, in which actual values are displayed. To keep this application simple, only limited number of measuring points are proccesed by this application. In that way we can get basic view of glass tank actual status.
Right part of screenshot displays historical trend in range of last 72 hours (3 days). No navigation to later data is provided here. Measuring points are arranged into 3 separated groups to keep number of curves on one page to max. 6. Graphs are plotted with the help of vector graphic. We can see also numerical data in table below graph if needed.
Back to schematic diagram. Actual values visualisation is classical chance for AJAX technology. Measuring points values are read and updated in background every minute, basic picture, description and javascript of this page stays static. Whether XMLHTTPRequest is running well we can check according to actual time, which is displayed at top of diagram.
At the beginning (sometimes in 2001) I used ActiveX object called Tabular Data Control for updating measuring points data. After FireFox expansion I went to Ajax. Both technology works very alike, but TDC is easier to handle. You can assign datasource attribut to some html elements and these elements are automatically refreshed after data receiving. You can update complete content of table with help of TDC too. Nice for database paging. It would be good if TDC was standardized in the same way as Ajax.
Application described here is an example how to present data from other systems in intranet. Because of read only data is required, such application is safe enough. There is no risc of database data alternation. Simplified navigation and data presentation requires no training or learnig time. You save for licences. It is possible to use such a way for economic and various ERP systems also.
updated 18.03.2006