
Intranet application Production Reports
Number of manufactured good products, defected products, plan performance etc. belongs to basic data in every company dealing with production. Application I am going to describe here was developed step by step for this purpose.
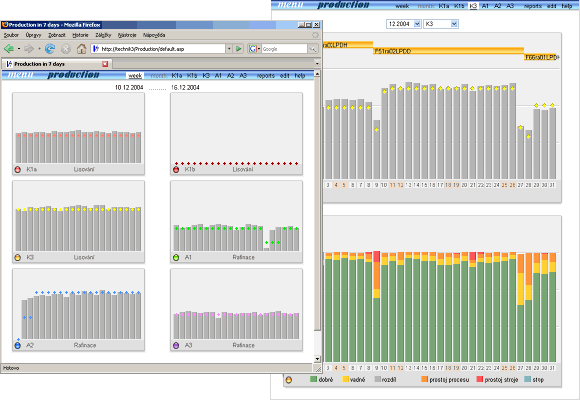
In the left part of scrennshots you can see graphs with production results of production lines. Everyone line has its own card, on which shift's plan performance in bar graph is presented. Bar graph displays history of production over the past 7 days. Each bar represents number of good products for one shift, and plan for this shift is marked by small color symbol. At first sight it is clear whether planned production on shift was fulfiled, whether production line was in start up state after job change, or whether line had been shut-down. When moving mouse over bar graph, then date, shift, production plan fulfilment and product type for the shift is dispalyed in descriptive stripe below the graph. When click on bar, user is navigated to page with shift production report.
In the right part of screenshot you can see monthly graph for one production line. Upper part of this page is similar to weekly graph with difference that each bar represents one day and total span of this graph is one month. Production job changes are displayed above the graph (analogy to graph in Production Plan).
If production line cycle is known, then number of products can be recalculated to equivalent time. Graph in lower part displays daily production recalculated to that time. Green part of bar indicate recalculated time of the day when only good products were produced, yellow indicate defective products and red is down time. The sum of good time, defective time and down time must give result 24 hours. In that way any bigger error in production data is promptly visible in bar graph, smaller errors doesn't matter. For those who believe in INGO, remember that green area matches the value of OEE (overall equipment efficiency).
In graph you may notice two job changes and corresponding drop down production of good products and one down time, length of a few hours, in the day after the second job change.
Following screenshot shows daily production report for one line.
The same report is provided for shift, day, month, non-stop running of
one product type. There are another reports also: montly performance
fulfiling of plan and yield. In the right there is shift report data
form.
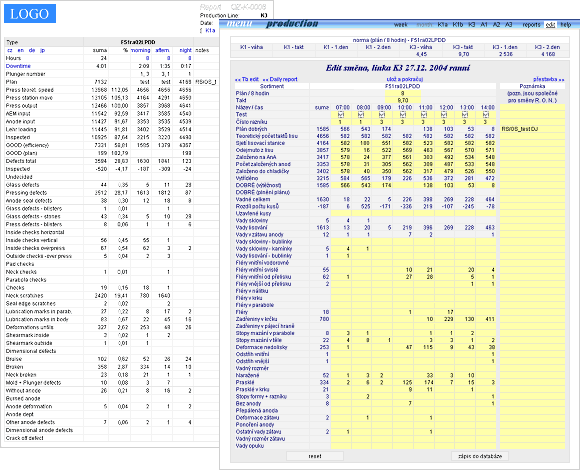
Majority of data in form comes from application Visual Defects. After each shift termination, data from visual defects files are transfered to the database by server script. Subsequently, when shift leader opens edit form (screenshot above), numbers of good and defecive products are already filled in and the only need is to append the form with additional data (product type, plan, notes). The form allows to make correction in any pre-filled input field if needed.
Note please, that this is very huge form. All yellow boxes are input cells. There are close to 400 input cells. Zero values are suppressed in form and reports for better reading.
Originally both application (Production Reports and Visual Defects) were running on separated servers and for data transmission was used XMLHttpRequest (today AJAX). This method is not applicable only for transmission between server and client, but also between servers in the same domain. Later, when both applications were moved to single server, mentioned method of data transmission stayed on.
updated 10.06.2006