
Intranet application Power Supply
For electrical power station, and later on for compressed air station was installed control system. Current system provides information for workers in control room only.
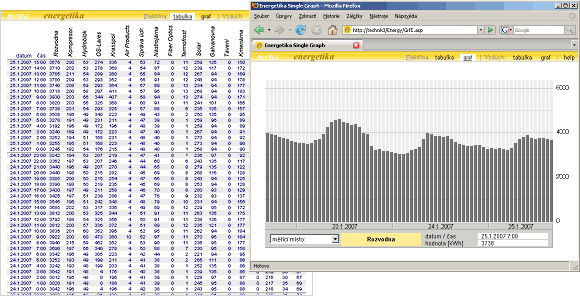
It was natural requirement to display consumption of energy, so that managers of production shops would see actual and historical take off of energy for their section. Nice opportunity for small intranet application.
After settlement with supplier of control system, this system was modified to save selected data to the file. We picked out simple file type (.csv). One line of ASCII data includes data for one hour. Data starts with date stamp (date and time), followed by take-off energy data of measuring points according to declared sequence. These data are separated by comma. It was adjust duration of history for 3 days, as a whole 72 lines in file. Data file is rewriten every hour. New data are added on the first line, the last line falls out. The data file was saved on work station where control system runs. It was mistake. Data should be in principle saved on server!
Then the problem arisen: how to read file from remote workstation. We tried to adjust access permissions according to Microsoft instructions, but every time, when the problem seemed to be solved, after restart or after OS update the connection was lost. Finaly problem was resolved by developing of component, which watch for modification of the file on remote PC and in case of change, the file is copied on intranet server, where this file is always accessible.
Program is not real application, in fact it is several simple scripts. Program reads data from file with help of object FileSystemObject, every line is broken down to single data with the help of function Split and data are formated to HTML table. For graph there is need to calculate and test bar height and for date marking (displayed just below graph) it is neccessary to calculate colspan.
Interesting problem was unsuccessful experiment to turn the names of measuring points by 90° with help of CSS or VML (to narrow space for table). In the end I back down that and made the names of measuring points as pictures.
Pages are automatically refreshed, to display always actual values. Refresh interval is calculated by server so that browser requests new page just after new data are ready on server.
updated 06.06.2006