
Intranet application Gauging

Short introduction first. In the picture there is machine for dimmension measurement. Glass part is inserted into machine and gauging cycle starts. Micrometers (around and above glass) are pushed to gauging position and equipment in the right part of picture makes evaluation of dimmension. Amplified signals from micrometers, go to A/D convertor in PC. Digitalized signal is converted to physical unit (1/100 mm), next digital filter is used, calibration correction is invoked, derived values are calculated and finally limits are tested. Then values are displayed. This cycle over all measurement points shoud pass at least 5 times. For all this job is 200 msec available. This measuring is procesed by industrial PC.
In the picture above there is one from more types of gauging machine.
In this case 20 direct points and two calculated (derived) points
are measured. Two methods of gauging is possible. When sorting gauge runs,
products are separated to good or bad and 100% products are measured.
During sequence gauging, all measured data are stored on server for
further reporting and analysis. At this type of measuring, so called
factors are manualy entered to PC. Factor means position number of
production machine.
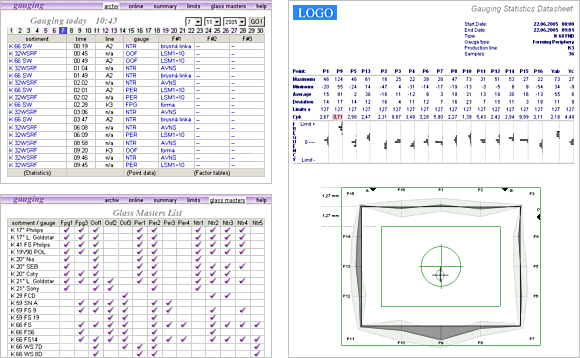
Intranet application, which processes files saved by gauging machines is shown in screenshots. In top left part there is application home page where list of sequences for selected day is displayed. Above the list is calendar form, completed by linear month calendar for date selection. Each sequence is described by product type, time of creation, production line, type of gauging machine and factors. Links in the sequence table point to different gauging reports.
One report example is in right side of screenshots. You can find there statistical data max., min., average, deviation and Cpk for each measuring point. Background colour of Cpk changes to red when it comes out of limit. Below statistics there are histograms for each gauging point. Finally there is schematic diagram of measured data. Dark gray maps average value of measuring point, light gray means deviation (3 x sigma). Vector graphics is used for diagram drawing.
Other reports serve for dimmensions evaluation according to single factor, or for print-out of all measured data (are not in screenshot).
Sometimes it is useful, when reports are created so that CSS and graphics are part of html and you do not use any auxiliary file. It is possible to save such pages to the only one .html file and then, in case of need, post this file to customer via email.
Lower left part of screenshot displays list of Glass Masters. These are etalons for calibration, or adjusting gauging machines. Table keeps summary overview for which product type and gauging machine glass master is established. Further by clicking on icon we get table with registered values of that glass master. Similar page for limits listing is provided also.
There are some other capabilities included in this application. Separated sequences can be sumarized in selected interval up to one week. It is possible to display on line data from sorting gauges, when 100% of production is measured.
updated 21.11.2006