
Real time bar graph by help of AJAX and CSS
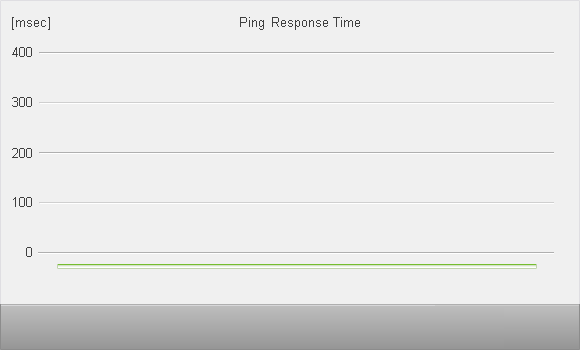
Here is live demo of dynamic CSS bar graph, which reads data from web server by help of Ajax functions, description of HTML, CSS and JavaScript code for data transmition, data representation and graph sliding. Graph displays response time of ping executed by web server.
This example originates from intranet application liveLAN, which performes as database of LAN devices, IP address allocation and for rapid test of LAN status. Test of device status is performed by the help of ping with graphic presentation of results.
Ping cannot replace more complex diagnostic tools, but thanks its simplicity ping is irreplaceable tool for fast diagnostics of LAN devices, and also for Internet availability tests. Standard PC XP SP1 are prohibited to respond to ping by default (can be changed). Servers, switches and printers, which are in our intrest, respond to ping usually without problem.

Enter destination device address for ping into yellow input field and by button start begin periodic pings on this device. Response time is ping delay between web server (situated in Czech Republic) and destination device. There is not possible to address devices in your LAN (behind firewall). Delay of last mile of your PC is not taken into account. Address can not be longer than 24 characters. Provided that input field is empty, server responds random value as response time. During scanning it is not possible to change address, you have to stop scanning first.
Bar graph begins to draw after start of scanning and is shifting to the left, values quite left are lost. Values for graph are obtained from server by help of AJAX. Current values of response time are rendered in green color, values shorter than 10 msec are dark green and uniform bar height 5px. Lost packet is marked by red color and scanning start is separated by grey bar.
Below graph is situated sliding arrow for digital value retrieve of any displayed bar. You can set position of arrow by drag&drop method. Further are described key JavaScript functions. Entire code, including CSS, you can find in the source code of this page.
Bar Graph
Bar graph is usually created with help of images as bars, along with proportions adjusted by help of CSS. In example here empty elements div, are used instead of img. Property border-width creates height of bar and border-color provides color of bar. Complete graph in this instance consists from 240 single bars.
Single bar size is 220 pixels in height and 2 pixels in width. Bars are laid side by side without space. Chart background is filled with scale and description picture. That is standard img, not background. Therefore it is possible to print graph including "background", regardless of actual browser setting which is usually set not to print background pictures.
CSS:
.cont {width: 2px; height: 220px; top: 0; float: left;
       border-bottom: 0px solid #ccc;}

HTML:
<div class="cont" id="b0"></div>
<div class="cont" id="b1"></div>
...
To each single bar of graph is assigned unique id, which allow to "address" each graph element by Java Script and dynamically set property border-bottom according to ping value. CSS property border-bottom consists of three partial properties: border-bottom-width, border-bottom-style a border-bottom-color, that are separated by space. Be careful of different names for identical property style. While in style declaration correct name is border-bottom, in JavaScript code for the same property name of borderBottom has to be used.
According to standard box model total height of element is counted as sum of inner height, plus paddings, plus borders. When property border-width is changed, inner height of element has to be recalculated to keep total height of element constant.
Browser IE6 incorrectly renders very high bars (when inner height is close to zero). Such bars are shifted down. Therefore div element for bar drawing is 10% higher (220px), than required in other browsers.
Data Tranfer by Help of AJAX
As was noticed already, ping is executed by web server. Request for ping execution is initiated by browser with the help of XMLHTTPRequest. AJAX functions were already described in article Ajax machine status. Now we append the request with parameter. Request syntax is the same as form data submit by method get. Server script address is appended by question-mark [ ? ], parameter name, sign equals [ = ] and value of parameter. For example: /at/dyna/getPingData.asp?ip=www.google.com.
function ajaxPing() {
  URL = "/at/dyna/getPingData.asp?ip=" + document.getElementById("ip").value;
  delete req;
  if (window.XMLHttpRequest) { /* --- IE7, FF, Opera, ... --- */
    req = new XMLHttpRequest();
  }
  else if (window.ActiveXObject) {   /* --- IE6 and older --- */
    req = new ActiveXObject("Microsoft.XMLHTTP");
  }
  if(req) {
    req.onreadystatechange = processReq;
    req.open("GET", URL, true);
    req.send("");
  }
}
Function ajaxPing() creates object XMLHttpRequest, assembles URL address of server script, parameter incl. (IP address of destination device), set up function for proccessing of response and send request. IP address of destination device is obtained directly from input form field.
function processReq() {
  if(running == 0) return;
  var top, height, image, stamp;
  try {
    if(req.readyState == 4) {
      if(req.status == 200) {                 /* --- data ready --- */
        res = req.responseText.split("|");
        stamp =  res[2] + " = ";
        if((res[1]>-1) && (res[1]<=400)) {      /* --- ping: OK --- */
          image = "pingBar1.png";
          height = parseInt(res[1]/2);
          if (height <= 5) {          /* --- too short response --- */
            height = 5;
            image = "pingBar0.png"
          }
          top = 200 - height;
          stamp = stamp + res[1] + "msec";
        } else {             /* --- ping: device do not respond --- */
          image = "pingBar2.png"
          height = 200;
          top = 0;
          stamp = stamp + "n/a";
        }
        displayGraph(top, height, image, stamp)
        if(running == 1) {     /* --- next ping after 2 seconds --- */
          window.setTimeout("ajaxPing()", 2000);
        }
      }
    }
  } catch(e) {}
}
Function processReq() waits for data message from server. When received data are complete, processing of recieved data begins. Data message is splitted into partial data by the help of function split(). According to response time of ping value color of bar is set, values of style properties top and height are calculated and descriptor stamp is built. Further graph is updated and interval for next ping execution is set up.
req.responseText: www.google.jp|37|2008-06-25 13:42:25
Above is example of data message, by which server respondes to XMLHttpRequest. Format of message can be in XML, or in plain text. Here is applied plain text. Server and client scripts have to be programmed with reference to that unified format. Message consists of three data parts, separated by character pipe. First part of data is IP address to which ping was executed (for verification, if needed). Response time of ping is in the second part of message. If packet is lost this data are = -1. The third part of data message is server time stamp when ping was finished (ISO format).
Number of pings (2) and length of packet (32 bytes) are static data in server script. Therefore there is no possibility to set extreme long packet with multiple repeating and exploit server script for attack on web devices. Server script depends on server environment and is not described here.
Graph Shifting
Server script does not save ping results on server, therefore data have to be kept on client. Original client script saved data in JavaScript array. Here is used a bit slower, but interesting solution: as data store are used style properties and attributes of each bar in graph. Sliding or shifting of bar graph is implemented by copying style properties and attributes from bars on the right to bars on the left.
function displayGraph(top, height, image, stamp) {
  var R, L = document.getElementById("b0")
  for(i=1; i<240; i++) {
    /* --- graph shift to the left --- */
    R = document.getElementById("b" + i);
    L.style.top = R.style.top;
    L.style.height = R.style.height;
    L.src = R.src;
    L.alt = R.alt;
    L = R;
  }
  /* --- new data to the right side bar --- */
  R.style.height = height + "px";
  R.style.top = top + "px";
  R.src = "/at/files/" + image;
  R.alt = stamp;
  showDigi();
}
First of all reference to the first bar from the left is saved into variable L (destination object). This object is marked as id="b0". Now data are shifted or moved in cycle. Reference to source object is in variable R, values of style top, height and attributes src, alt are moved. Attribute src keeps path to image (color of bar), attribute alt retain descriptive text (time stamp when ping was executed and response time of ping). After shift of single bar is done, reference on bar objects is replaced, source object becomes destination object. After moving of all bars, new data are stored to the bar quite the right side, which is marked as id="b239" (in case of graph length 240 bars).
Digital Values Presentation
Arrow or sliding member below the graph determines, which bar is displayed in numeric form. Moving of arrow is done by the help of drag&drop, this method was described in article form date and time. You can move the arrow also during scanning and read digital data as needed.
function showDigi() {
  /* --- display description data according to arrow position --- */
  x = parseInt((parseInt(document.getElementById("arrow").style.left)+8)/2);
  t = document.getElementById("b" + x).title;
  document.getElementById("descr").innerHTML = t;
}
Position of arrow x is calculated at first. Because .style.left returns value including units (here px), units are separated by the help of inner function parseInt(), outer parseInt() makes conversion to integer value. That value is used then for addressing of img object. Descriptive text saved in attribute of that object is moved to the element <div id="descr">. Function showDigi() is called when graph is shifted and at arrow sliding.
Possible problems
This page works well only when JavaScript in your browser is turned on. Address size is limited to max. 24 characters, longer address is cut, that is why it can be evaluated as nonexistent address.
When initial position of arrow is set by the help of CSS declaration only, it is not possible to read value of style.left in JavaScript. Therefore function initArrow() had to be added to set correct value into style property.
You can print or save screenshot of graph, but you can not save measured data in graph. There is no way to save page for later reuse of original graph. Setting provided by JavaScript are not exposed to the source HTML or CSS code.
You can use code of this page in your intranet, but keep in mind, that will you need also AJAX code on your intranet server. In this case that is AJAX server script getPingData.asp. Because of security restriction, browser can request data by the help of XMLHTTPRequest object only from the same domain, from where original page is downloaded.
updated 2023-10-31