
Intranet application Laboratory
This application has passed through long evolution and many changes were done since of the year 1999 when the first version started. Original presumption was to unify just a few reports, but it was increased to almost 30 types of reports. Application was extended by values of limits, test on their overrun, uncertainty of measuring values and graph output was added.
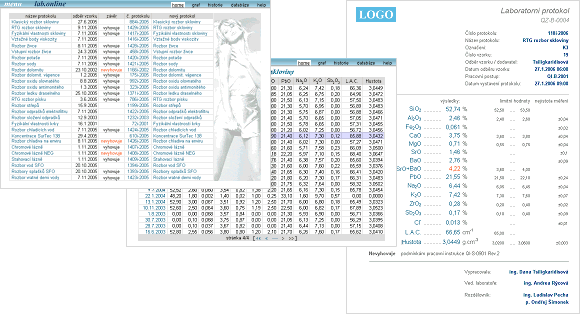
In the left side of picture you can see start page of application, where the list of all report types is displayed. There are date of the latest analysis, result of limit test, number of the lastest report and link to new form for analysis data. Just for fun the table is extended by picture.
In the middle part of picture you see the list of analysis of one report type. Each line of table contains date of analysis followed by analysis data. Over or under limit values are displayed in red. You can paging this table to find older reports.
Right side of picture shows single report. Some mandatory items are situated in report header. For each measured ingredient or element there is title, measured value, unit, limits and uncertainty of measuring. In lower part of report there is a place for note, conclusion of analysis and distribution list.
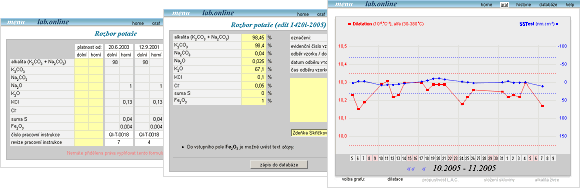
In the second picture on left you see form for limits setting. There is form and four last limit records for that protocol type. Similar form is used for set up measuring uncertainty, operating instructions, distribution list and list of laboratory stuff.
Further you see some sample form for data entry. Data of new analysis is entered by laboratory assistant, corrections if needed, is able to carry on by laboratory leader only (it is necessary to have different type of access permission for edit).
Last example, on left, shows some graphics results. Graph range is approximately one month and actual data are displayed. It is possible to navigate the graf to previous or next month data. Limits (as far as are set up), including limit changes according to corresponding date are outlined in graph as dotted line. For drawing of graph is used vector graphics (MS VML). This approximately matches standard SVG graphics. Great vector graph benefit is nice, smooth lines at printed sheets.
By implementation of Laboratory application fall away a lot of papers, information delivery was accelerated and reports were unified in shape. Technologists doesn't need to rewrite values into their own tables, even create their own graphs. One, ISO problem was, how resolve authenticated handover of reports. In the end it is so that laboratory department keeps one copy of each report and from time to time reports are signed by relevant worker according to distribution list.
updated 04.06.2006